

Data Visualization Tool
The ability to visualize and interpret data is a game-changer. Whether you’re a data analyst, business professional, or aspiring data scientist, mastering tools like Power BI, Tableau, and Looker Studio can help you:
Next Batch start on
This Weekend
DURATION
04 Months
360 Degree
Placement assistance
ELIGIBILITY
Graduation (Any Stream) or In the final year of Graduation & Young Professionals
Why Learn
Data Science
Mastering Full Stack Data Science is essential for unlocking high-paying career opportunities. From data analytics and visualization to machine learning and AI, this course covers everything you need to become a data science expert.
Why Choose Codeintips?
Explore our top certification courses, trusted by thousands of student to boost your skill

Interactive Courses designed by experts

100% Placement Assistance

Limited Batch Strength

Interviews Preparation Sessions

One Year Live Session Access

Capstone Project

Work on Live Projects

24/7 Support For Seamless Learning

Grooming Session

Communication Session

CV Building

Mock Test

HR Interview Rounds

100% Practical Training

Comprehensive Curriculum
Why Choose Codeintips?
Explore our top certification courses, trusted by thousands of student to boost your skill
Interactive Courses designed by experts
100% Placement Assistance
Limited Batch Strength
Interviews Preparation Sessions
One Year Live Session Access
Capstone Project
Work on Live Projects
24/7 Support For Seamless Learning
Grooming Session
Communication Session
CV Building
Mock Test
HR Interview Rounds
100% Practical Training
Comprehensive Curriculum
Featured Courses
Explore our top certification courses, trusted by thousands of student to boost your skill
Full Stack Development
Access a wide range of tech courses from anywhere, anytime
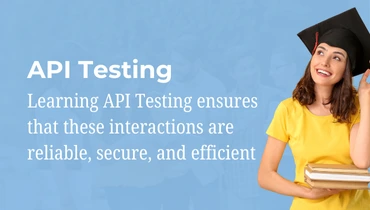
Software Testing
Access a wide range of tech courses from anywhere, anytime
Data Science
Access a wide range of tech courses from anywhere, anytime
Digital Marketing
Access a wide range of tech courses from anywhere, anytime
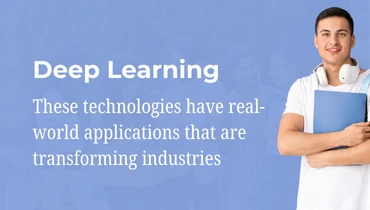


Machine Learning
Access a wide range of tech courses from anywhere, anytime
Data Science
Access a wide range of tech courses from anywhere, anytime
Digital Marketing
Access a wide range of tech courses from anywhere, anytime
Web Developement
Access a wide range of tech courses from anywhere, anytime
Course Overview
Our comprehensive syllabus covers everything from the fundamentals to advanced techniques, ensuring you gain hands-on experience with real-world applications. Here’s what you’ll learn:
1. Getting Started with Power BI
Overview of Power BI ecosystem
- Understanding Power BI Desktop, Service, and Mobile
- Connecting to diverse data sources: Excel, SQL Server, and
2. Data Transformation in Power Query
Cleaning and transforming datasets
- Removing duplicates, splitting columns, and merging
- Handling missing data and reshaping
Understanding M-code
- Basics of M-code for advanced
3. Data Modeling
Establishing relationships
- Understanding one-to-one and one-to-many
- Implementing star schema for analytical
Optimizing models
- Setting up calculated columns and
4. Data Visualization in Power BI
Creating impactful visuals
- Using bar, pie, line, and scatter plots for effective
- Designing custom visuals with Power BI
Interactivity features
- Implementing slicers, drill-throughs, and report
5. Introduction to DAX (Data Analysis Expressions)
Basic DAX measures
- Using SUM, COUNT, and AVERAGE for
Logical functions in DAX
- Applying IF, SWITCH, and conditional
Time intelligence
- Performing YTD, MTD, and QTD
6. Publishing and Collaboration
Publishing reports to Power BI Service
- Sharing dashboards and managing
Module 1: Introduction to Tableau
- Overview of Tableau
- What is Tableau?
- Importance of Tableau for Data Analysts
- Tableau Product Suite: Tableau Desktop, Tableau Public, Tableau Online, Tableau Server
- Getting Started with Tableau
- Installing Tableau Desktop or Tableau Public
- Understanding Tableau Interface
- Connecting to Data Sources (Excel, CSV, SQL,)
Module 2: Data Preparation and Connections
- Connecting to Data
- Connecting to different file types (Excel, CSV, SQL databases,)
- Live Extract Connections
- Data Preparation
- Data Cleaning and Transformation in Tableau Prep
- Joins, Blends, and Relationships
- Pivoting and Splitting Columns
- Understanding Metadata
- Data Types and Roles
- Managing Hierarchies
- Creating Calculated Fields and Sets
Module 3: Building Basic Visualizations
- Introduction to Charts
- Bar Charts
- Line Charts
- Pie Charts
- Scatter Plots
- Tables and Text Visuals
- Cross-tabs
- Highlight Tables
- Heat Maps
- Using Filters and Sorting
- Dimension and Measure Filters
- Interactive Filters
- Sorting and Grouping
Module 4: Advanced Visualizations
- Advanced Chart Types
- Dual-Axis Charts
- Tree Maps
- Bubble Charts
- Waterfall Charts
- Gantt Charts
- Geographical Analysis
- Maps and Spatial Analysis
- Using Map Layers
- Dashboards and Stories
- Building Interactive Dashboards
- Adding Filters and Actions
- Creating Stories for Presentations
Module 5: Advanced Analytics
- Calculated Fields and Table Calculations
- String, Date, and Logical Functions
- Aggregate and Level of Detail (LOD) Expressions
- Forecasting and Trend Analysis
- Adding Trend Lines
- Forecasting
- Creating and Using Parameters
- Dynamic Filtering and Highlighting
Module 6: Collaboration and Sharing
- Publishing and Sharing
- Publishing to Tableau Server or Tableau Online
- Sharing Workbooks and Dashboards
Module 8: Case Studies and Projects
- Industry-Specific Projects
- Sales and Marketing Dashboards
Module 1: Introduction to Looker Studio
- Overview of Looker Studio
- What is Looker Studio?
- Importance of Looker Studio for Data Analysts
- Looker Product Suite: Looker Studio, Looker Pro, Looker Embedded
- Getting Started with Looker Studio
- Setting up a Looker Studio Account
- Understanding Looker Studio Interface
- Connecting to Data Sources (Google Sheets, BigQuery, MySQL, etc.)
Module 2: Data Preparation and Connections
- Connecting to Data
- Connecting to different data sources (Google Sheets, BigQuery, SQL databases, etc.)
- Live vs. Extract Connections
- Data Preparation
- Data Cleaning and Transformation in Looker Studio
- Joins and Blends
- Pivoting and Splitting Columns
- Understanding Data Schema
- Data Types and Roles
- Managing Fields and Dimensions
- Creating Calculated Fields and Parameters
- Data Modelling in Looker
- Defining Explores, Views, and Fields
- Using Persistent Derived Tables (PDTs)
Module 3: Building Basic Visualizations
- Introduction to Charts
- Bar Charts
- Line Charts
- Pie Charts
- Scatter Plots
- Tables and Text Visuals
- Cross-tabs
- Scorecards and KPI Metrics
- Heat Maps
- Using Filters and Sorting
- Dimension and Metric Filters
- Interactive Filters
- Sorting and Grouping
Module 4: Advanced Visualizations
- Advanced Chart Types
- Bullet Charts
- Geo Maps
- Tree Maps
- Funnel Charts
- Gauge Charts
- Geographical Analysis
- Maps and Spatial Analysis
- Using Geo Data in Looker Studio
- Custom Visualizations with LookML Dashboards
- Dashboards and Reports
- Building Interactive Dashboards
- Adding Filters and Controls
- Creating Reports for Presentations
- Using LookML for Custom Dashboards
Module 5: Advanced Analytics
- Calculated Fields and Formulas
- String, Date, and Logical Functions
- Aggregate and Window Functions
- Forecasting and Trend Analysis
- Adding Trend Lines
- Predictive Analysis with BigQuery ML
- Creating and Using Parameters
- Dynamic Filtering and Highlighting
Module 6: Collaboration and Sharing
- Publishing and Sharing
- Sharing Reports via Email and Links
- Embedding Reports into Websites
- Managing User Access and Permissions
- Scheduling Data Deliveries
Book a Live Demo Class
Register to attend the Free Demo Today
Meet our Teachers
Passionate educators, industry experts, and coding mentors—our teachers at CodeInTips are here to guide you through every step of your learning journey. 🚀
Image Accordion #1
Image Accordion Content Goes Here! Click edit button to change this text.
Image Accordion #2
Image Accordion Content Goes Here! Click edit button to change this text.
Image Accordion #3
Image Accordion Content Goes Here! Click edit button to change this text.
Image Accordion #4
Image Accordion Content Goes Here! Click edit button to change this text.
Latest News
Our ‘Latest News’ section brings you the freshest insights and tips on programming languages, software development, and tech innovations.

AI-Powered Coding: The Future is Here!
AI tools like GitHub Copilot and ChatGPT are transforming coding, making development faster and more efficient. Stay ahead with the latest AI-driven innovations!

Python 3.12 Released – What’s New?
The latest Python update brings better performance, enhanced error messages, and improved pattern matching. Upgrade now and explore the new features!


About Codeintips
Codeintips is a leading tech-upskilling platform dedicated to empowering professionals with cutting-edge skills in the ever-evolving world of technology.
Quick Links
Popular Courses
Data Science(DS)
Data Analytics
Software Testing
Digital Marketing
Full Stack Devlopment